Processing DJI L2 Data

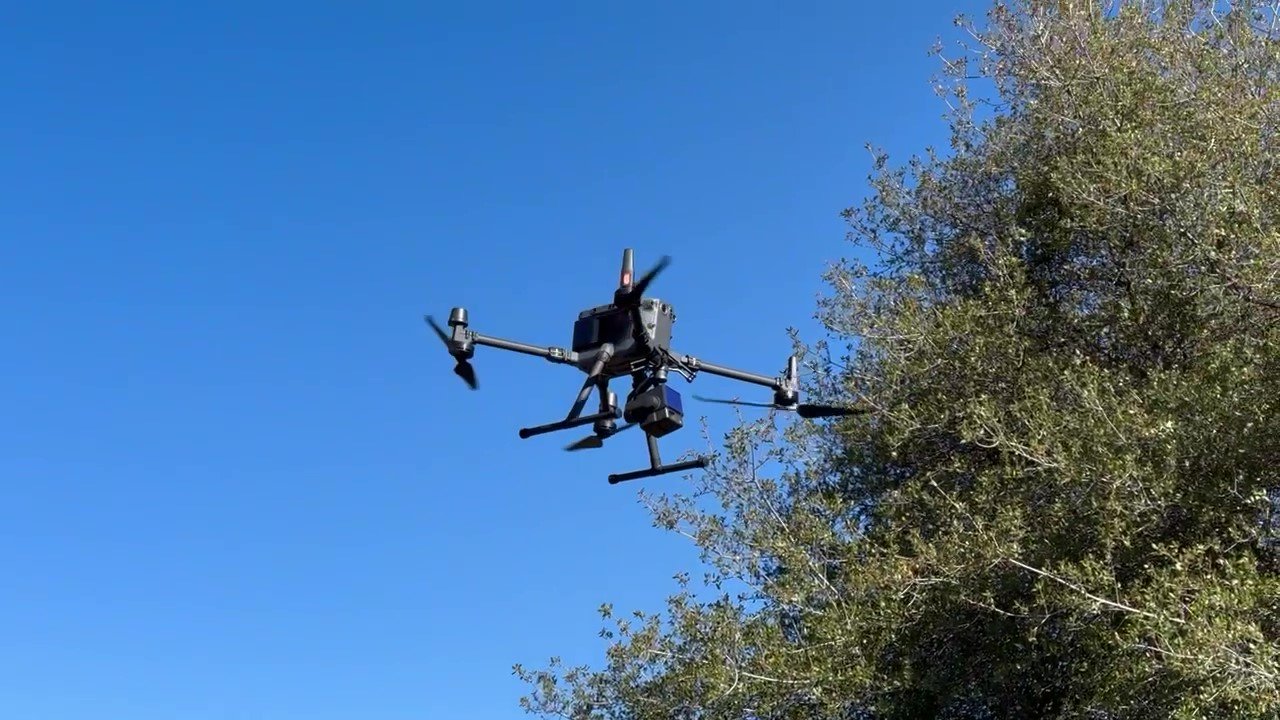
The DJI L2 is the latest and greatest lidar sensor released by DJI that is slowly starting to make its way into the hands of surveying and mapping professionals globally. Promising a plethora of upgrades over its predecessor, the L1, the DJI L2 has been hotly anticipated to lower the cost and improve the quality of lidar mapping. As part of our testing process, we took the DJI L2 into the woods of central California to do some real world testing in fairly difficult conditions, and these are the results.
Unlike most of our technical posts, this article is not designed to demonstrate a specific technical process. Rather, this is a more open-ended deep dive into the details of the L2 data and some processing workflows. We will be going through many of our preferred workflows, procedures, and software that we use to process lidar data internally.
There are an infinite number of different ways to process and analyze large data sets such as this, and it would be impossible to cover all of them. That is why, as part of this article, we are making all of the data from these flights available to the public. So if you are looking for high-quality lidar data you can use to research, develop, or improve your own data processing abilities, then this is the right place. It can be downloaded at the bottom of this page.
Overall Thoughts
The DJI L2 is, in our opinion, the best overall Lidar sensor on the market right now. No, it is not perfect, and there remains room for improvement in a number of areas. However, creating and processing L2 data is easier than with any other lidar sensor on the market by a wide margin. And the data quality improvement over the L1 is meaningful. The accuracy, resolution, and ability to penetrate multiple layers of dense vegetation all impress. Meanwhile, there is still enough flexibility and information provided to allow for more advanced forms of data processing, from tweaks in photogrammetry settings to custom PPK processing of the DJI base station.
The most important metric at the end of the day is still accuracy. At an altitude of 200’ above ground, the DJI L2 lidar sensor produced a real world vertical accuracy of 0.07’, when measured as the root mean square error of independent checkpoints on non-vegetated surfaces. The photogrammetry sensor of the L2 produced comparable vertical accuracy, but with a much higher ability to resolve horizontal features, showing an RMSE of 0.08’. Even at the higher altitude of 400’ AGL, the L2 lidar had a real world vertical accuracy of 0.14’, and photogrammetric accuracy of 0.14’ vertical and 0.10’ horizontal.
Ultimately, the accuracy of the DJI L2 sensor is fantastic for even the most stringent topographic requirements. However, it is still unable to compete with terrestrial accuracy for lidar, where system accuracy can occasionally be as low as a few hundredths of a foot. But for surveying large vegetated sites, especially where ground access is limited, there is nothing better on the market.
At Aerotas, our business is providing drone data processing services to land surveyors throughout the United States. From photogrammetry, to lidar processing, to CAD drafting, we can help you get the most out of your drone mapping program. If you are interested in learning more about how Aerotas can help your business, let us know using the form below.
Procedures
The procedures of this test were designed to mimic real world flight conditions. Our goal was not to make dozens of flights or wait for perfect conditions, but rather to test the capabilities of this sensor in the same way that it would be used in the real world. As such, we only created 3 flight plans. For the initial testing and accuracy measurements, we only processed each dataset a single time, as would be common in commercial photogrammetric and lidar missions.
Flight Patterns
DJI L2 Sensor - 400’ AGL
DJI L2 Sensor - 200’ AGL
DJI P1 Sensor, 24mm Lens - 400’ AGL
Each flight was flown with 75/75 overlap, which equates to about 65% side overlap for the lidar data. The flights were flown with terrain awareness enabled to accommodate the elevation changes of the site. The flights were flown with RTK enabled and connected to a local DJI D-RTK-2 base station that was set up over a completely arbitrary point. This workflow was necessary as we had no prior visits to the site to establish a known location for the base station, and there is no internet connectivity for any sort of network based solution.
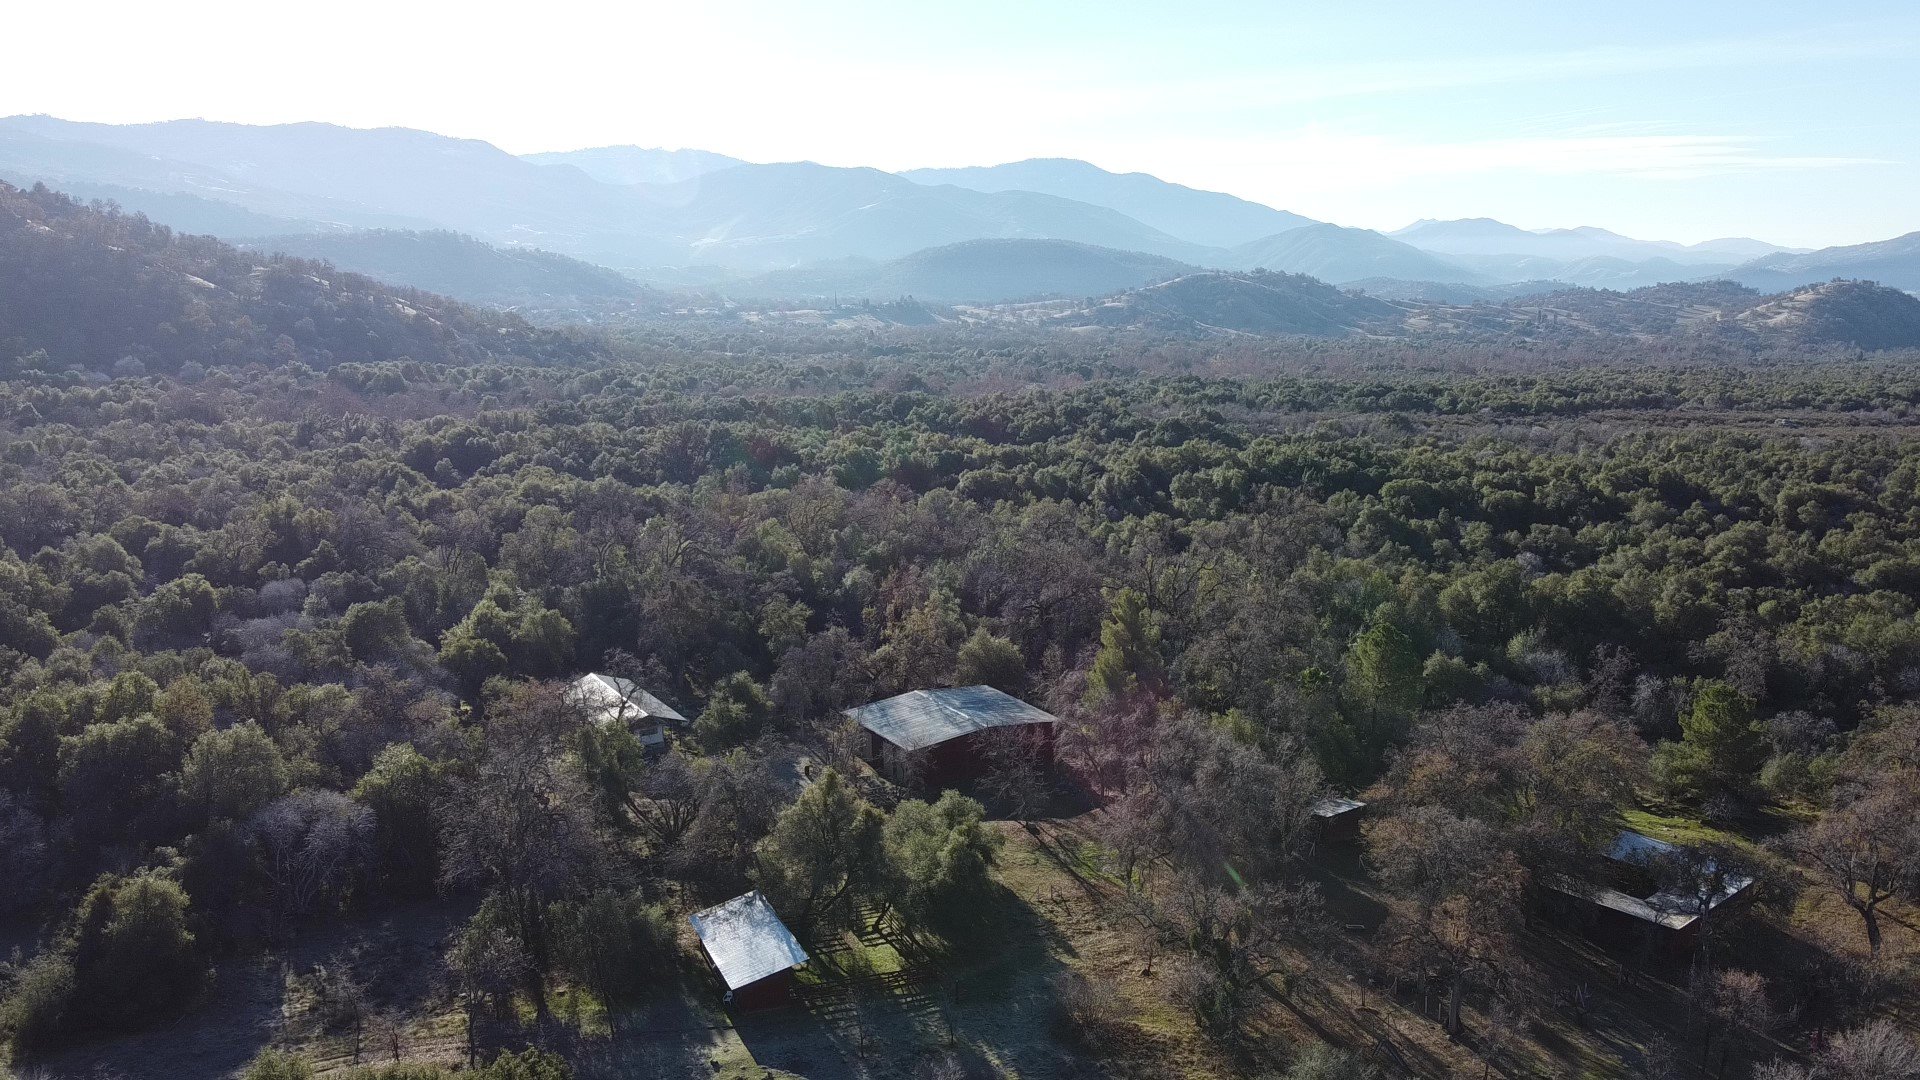
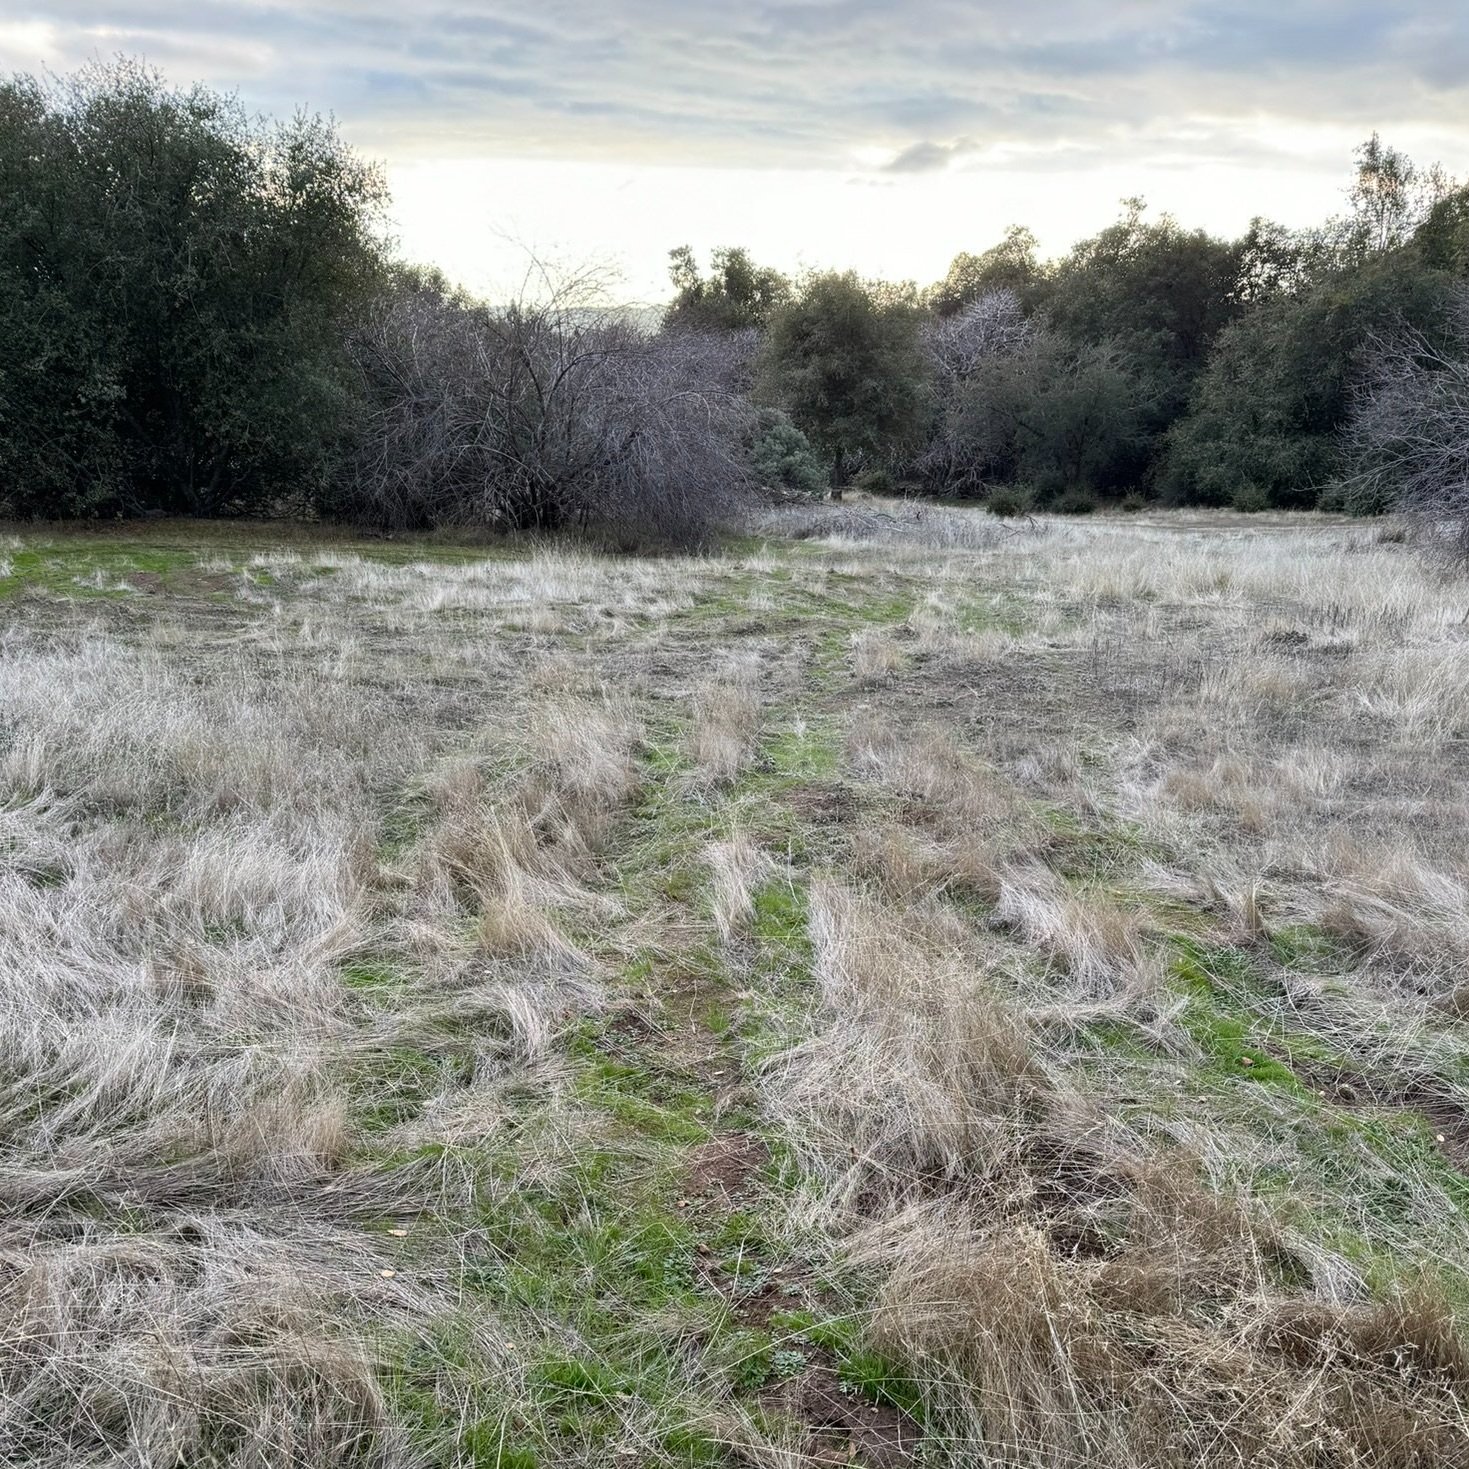
Site Conditions
The project site was explicitly chosen for many reasons to be extremely difficult to survey. It is a private property located in a glacial valley in a very rural part of the central California mountains. As such, there is no available power or communications infrastructure, necessitating a workflow that can be reliable with no practical ability to recharge, update software, or utilize any form of cell-based RTK networks. Large portions of the site are effectively inaccessible due to dense vegetation, enormous boulders and rock walls often exceeding 10’ in height, and plenty of thorny brambles and poison oak to punish any surveyor who would dare attempt to measure the site on the ground.
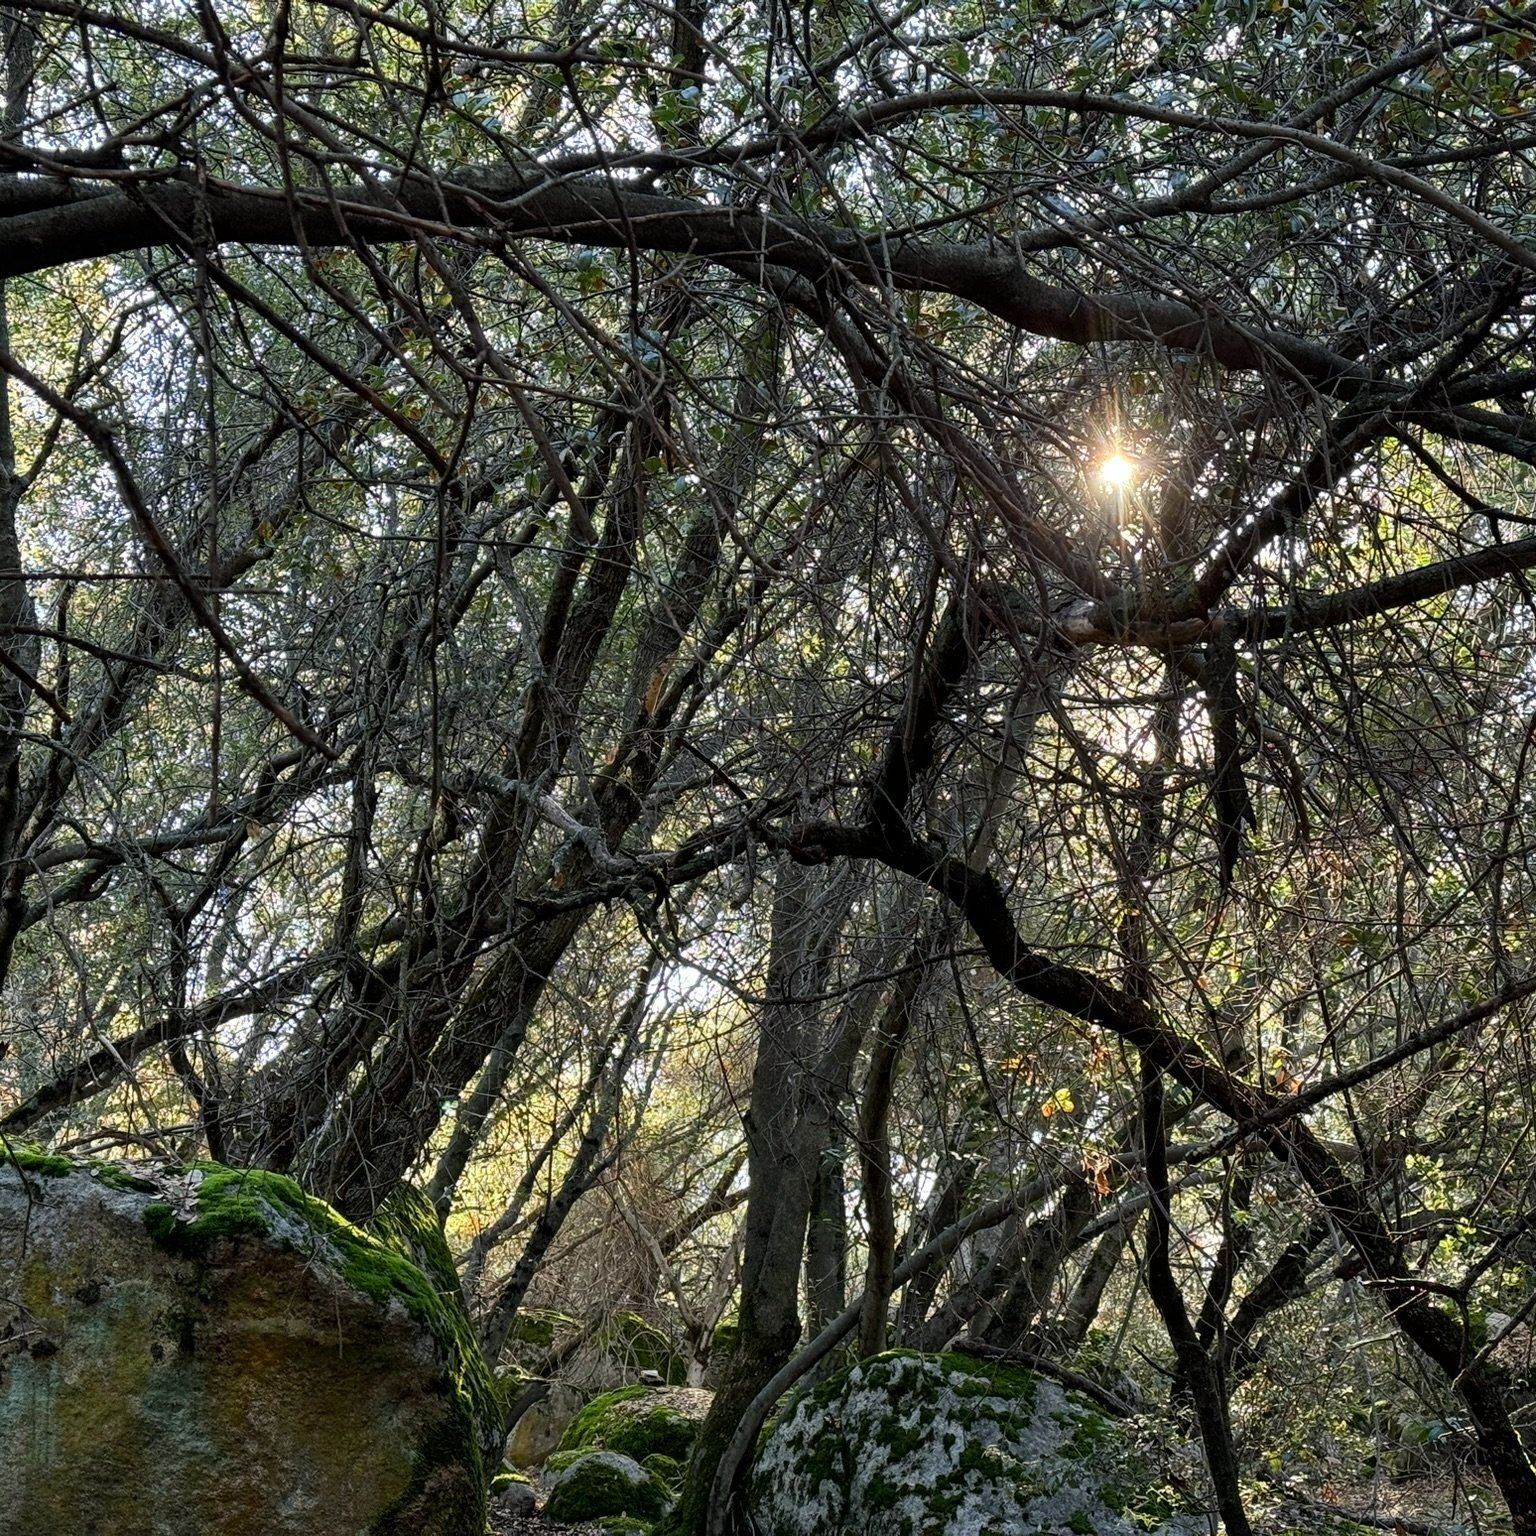
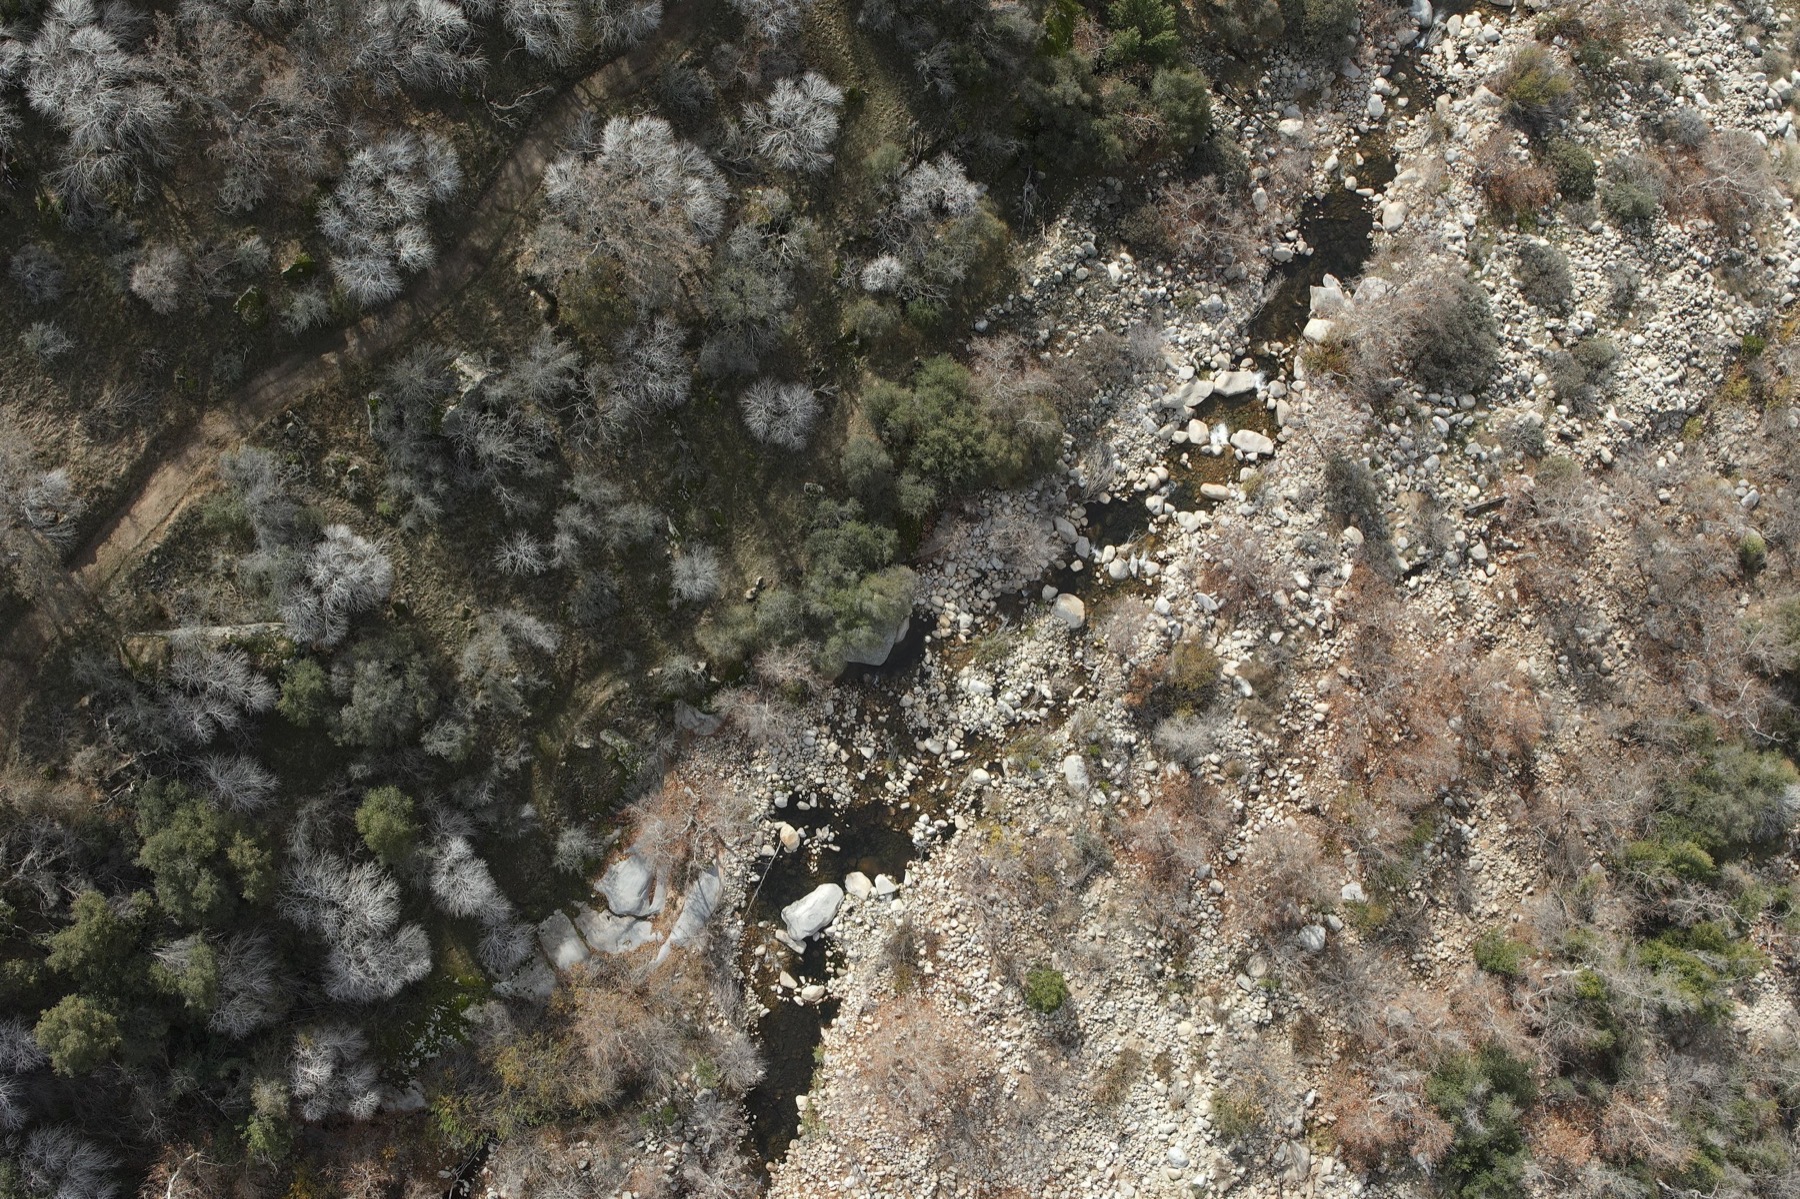
The total measured elevation change across the ~85 acre parcel is just under 200’, which would mean that terrain awareness is essentially required to achieve acceptable levels of accuracy. The dense vegetation means that photogrammetry will be extremely challenging for large portions of the site, and the areas that contain more buildings and hardscape are non-contiguous. And to make everything even more challenging, ambient temperature at the site on the day of flying was 35°F, reducing battery life and necessitating the batteries be warmed prior to their use. All of this uses up additional battery power, which cannot be recharged at the site due to its remote location.
Ground Data Collection
Our initial goal was to collect 100 total points to be used for data analysis as dispersed throughout the project site where possible, across a wide range of elevations, terrain, and vegetation types. However, the weather and challenges in simply carrying ground equipment throughout the site forced us to reduce the scope in the limited time we had on-site. As such, we were able to measure:
16 marked 3D targets
40 unmarked non-vegetated topographic points
17 unmarked vegetated topographic points
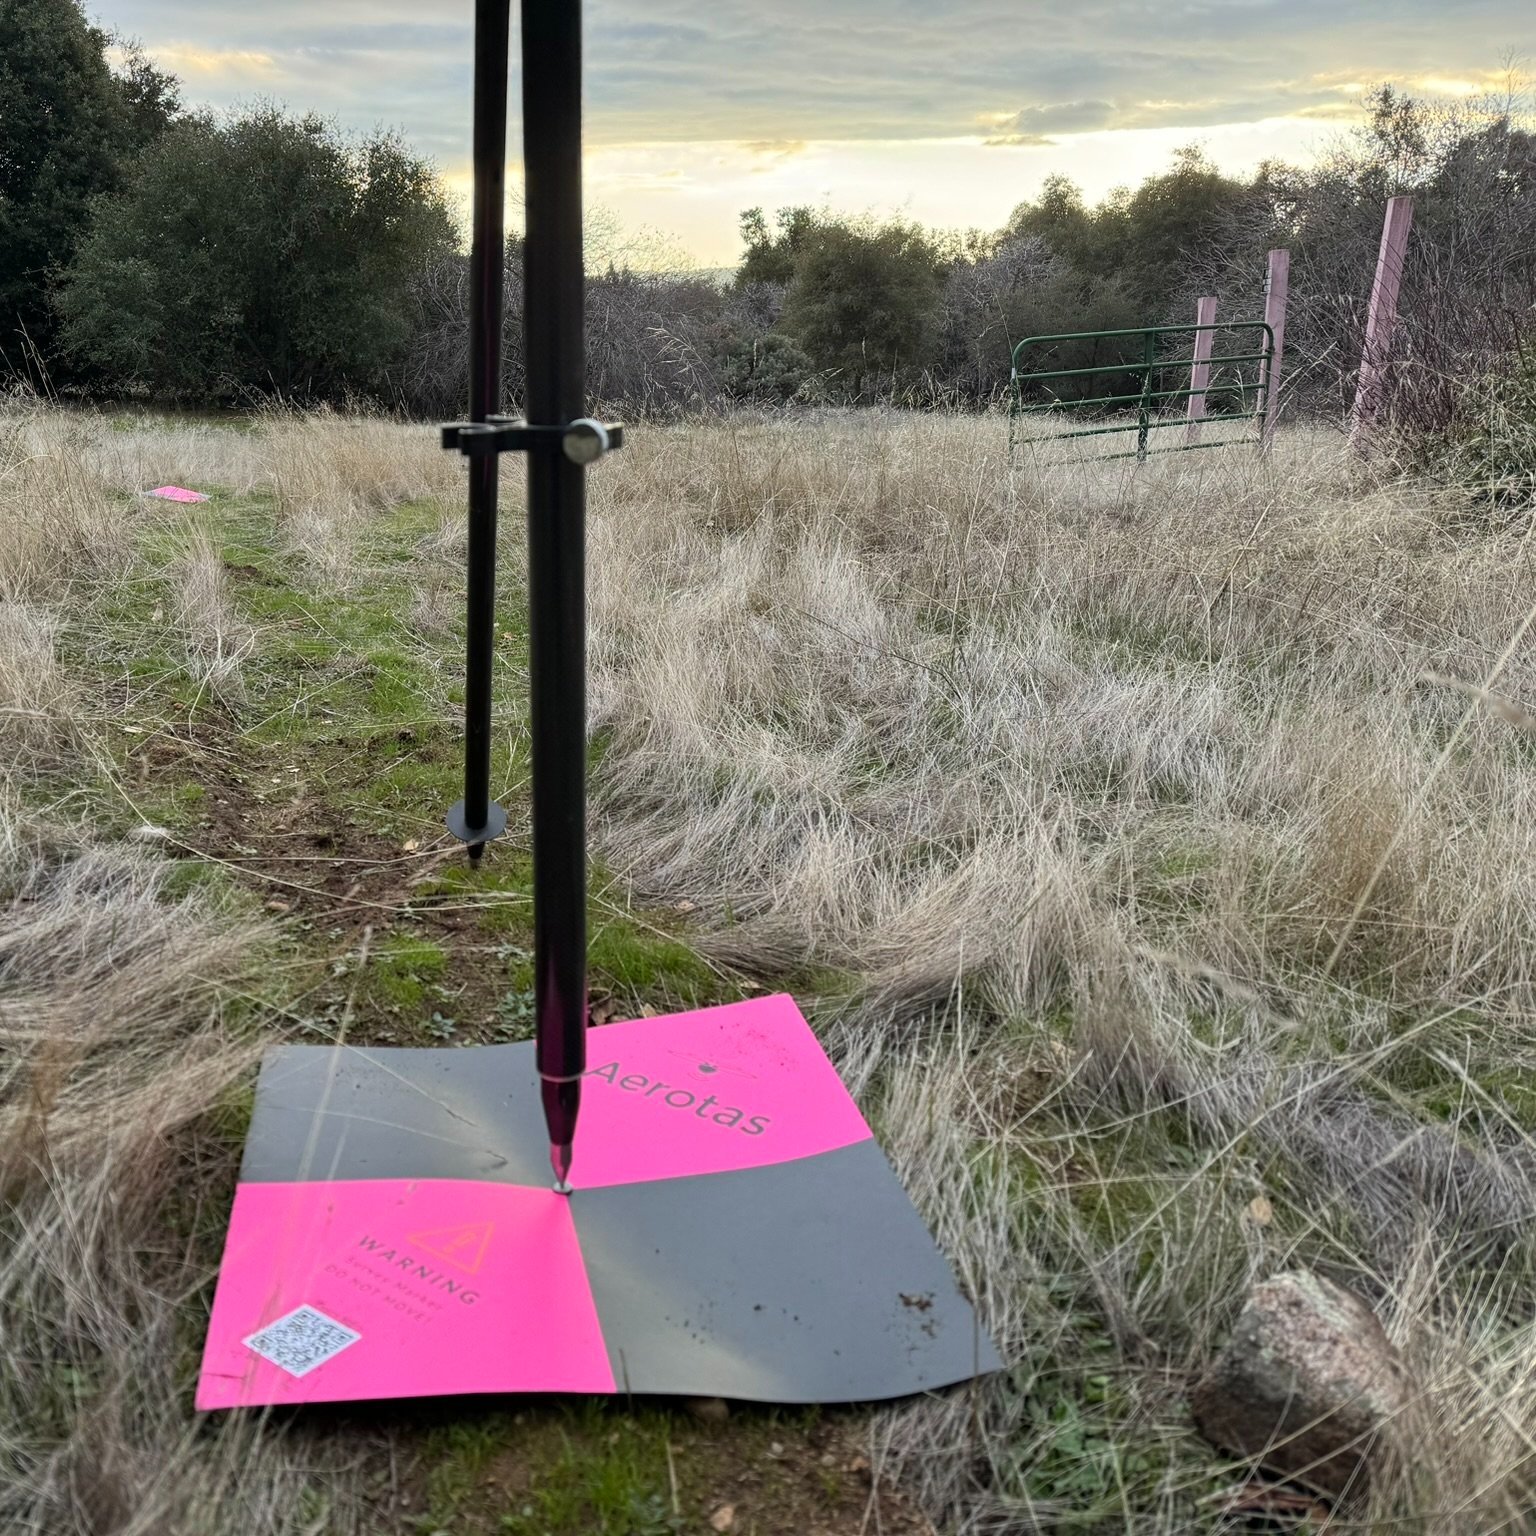
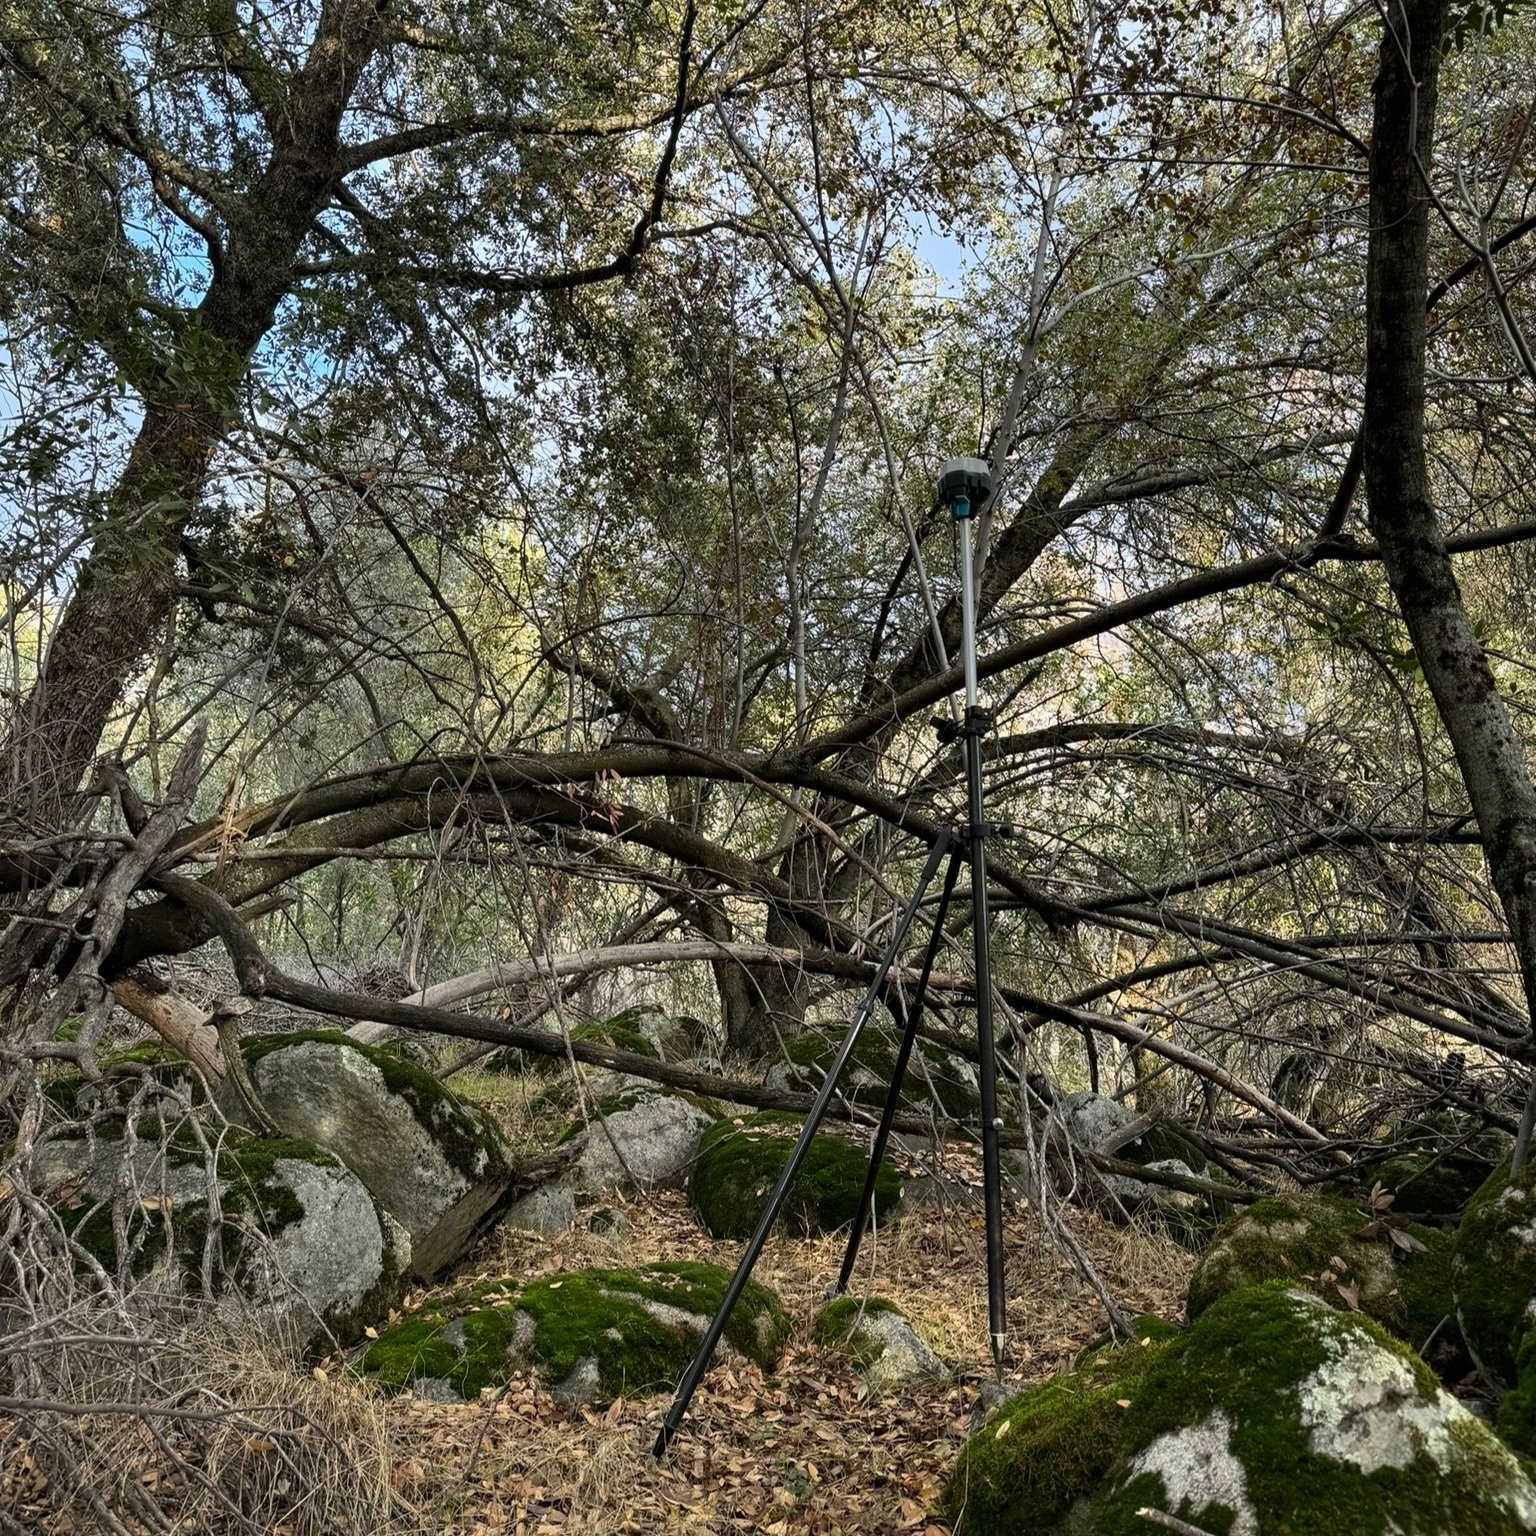
The points were measured using a set of two Emlid Reach RS2 units, one acting as a local base station on site, the other serving as the rover unit. All points, both for marked targets and unmarked targets were taken as the average of a 5-second observation with a fixed RTK solution. These were measured across two separate days with the local base station re-initialized on the second day. The ground data was post-processed using publicly available CORS base station data and open source RTKLIB software.
Duplicate measurements have been deleted from the final corrected control point file. All final measurements are presented in NAD83 / California Zone 4 (ftUS) (EPSG 2228) and elevations are in NAVD88.
Photogrammetry Processing
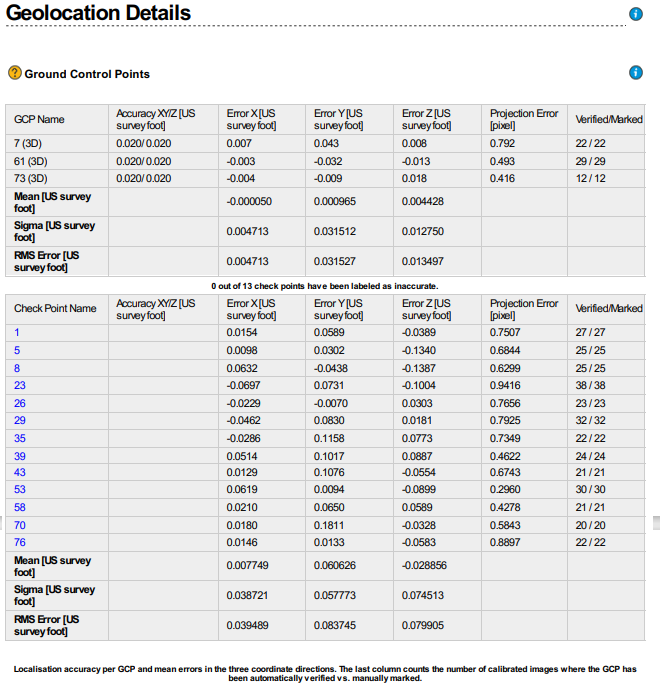
To simulate real world processing scenarios, each flight was photogrammetrically processed a single time with results measured after that single attempt. This is a deliberately limited scope intended to mimic how real world processing happens, including any and all errors that might only be detected after numerous rounds of advanced processing. In all 3 flights, 3 of the 16 marked targets were selected to be used as ground control points*, while the remaining 13 were used as checkpoints to measure the accuracy of the photogrammetric solution. The 3 ground control points are necessary both to properly calibrate the camera, as well as to translate the image geolocation to the right place. This is because the image geolocation measured using the DJI in-field software was calculated using a base station over an arbitrary location, which is an extremely common and robust workflow in photogrammetric processing.
*specifically points 7, 61, and 73 in all flights
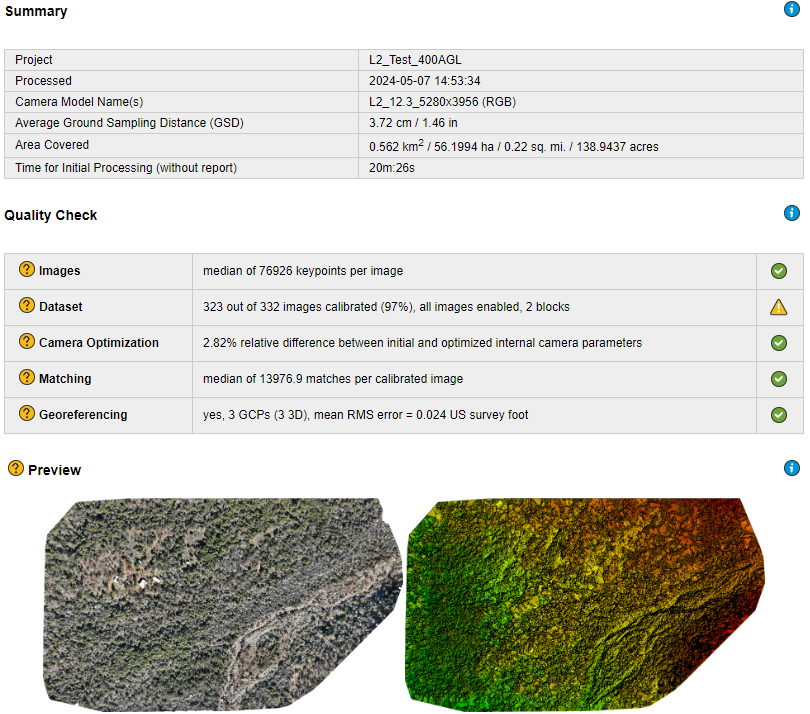
Pix4D Mapper was used both as the processing software, as well as for calculating the RMSE of independent checkpoints for photogrammetric processing. All settings were deliberately left to their “Default” values. At Aerotas, we actually typically have a much more robust and iterative process to create, analyze, and improve photogrammetry deliverables. However the changes that can be introduced are complex, fairly subjective, and may not be replicable, so we chose a simple one-shot workflow for the sake of this research.
Photogrammetry Results
In terms of overall photogrammetric accuracy as well as resolution, the results turned out in the order that we would have predicted. The L2 camera at 200’ AGL provided the best overall accuracy, with an RMSE less than 0.1’ in all 3 dimensions. Next came the P1 at 400’ AGL which provided accuracy of just barely worse than 0.1’ at 400’ AGL, but with less than 25% of the number of photos taken. The L2 at the highest altitude of 400’ AGL performed worst of the three flights, but was by no means a bad performer. With a vertical RMSE of 0.14’, the L2 can be considered perfectly acceptable for 1’ contours or basic topographic mapping even at the maximum legal flight altitude of 400’ above ground.
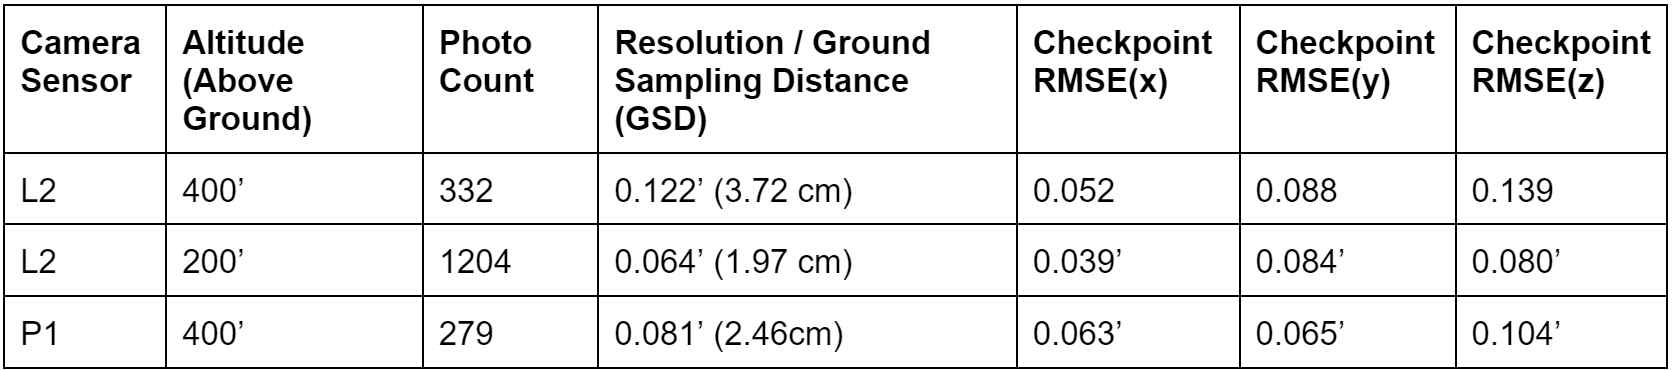
Of course, accuracy on checkpoints is not everything in photogrammetric mapping. The 200’ L2 flight, while it had the highest accuracy, also had numerous images fail to calibrate due to the density of the vegetation. Higher altitude flights, such as 400’ can help mitigate this problem and that was true here. This means that the 200’ L2 flight actually had numerous visual gaps in the orthophoto which could be a deal breaker on some projects. Furthermore, the 200’ L2 flight generated almost 4x the number of photos as the other flights, and took considerably longer to process.
Another interesting factor to note is that for both the L2 and the P1 camera, the horizontal error was actually lower than the average resolution of the project camera! The combined quality of image geolocation and sub-pixel interpolation has allowed aerial photogrammetry projects to start producing horizontal accuracy that is better than the resolution of the camera itself, something that was thought to be practically impossible just a few years ago. Vertical accuracy in all three flights is between 1.1x and 1.3x GSD, and can serve as a benchmark for estimating photogrammetric accuracy on future flights.
Overall, there is no clear winner of the three flights, as they all serve different survey purposes. The L2 at 200’ AGL has the best photogrammetric accuracy, but the most visual gaps in the orthophoto. The P1 provides the best looking orthophoto with good accuracy, but no lidar data. The L2 at 400’ provides the fastest and easiest way to collect and process both photogrammetric and lidar data, but at the expense of some accuracy. Which one is “the best” really depends on the needs of the final product deliverable.
Lidar Processing
DJI requires that all L1 or L2 data be processed first in DJI Terra. This software combines all of the raw GPS, IMU, and Lidar data in order to create an LAS point cloud. As with Pix4D, the data was processed in a single shot. The only setting we altered was to set point cloud density to 25%. Typically, a 100% point cloud density will result in much larger files without contributing meaningfully towards the overall accuracy and true resolution of the final product. The resulting point clouds had 58 million points for the 400’ AGL flight and 178 million points for the 200’ AGL flight.
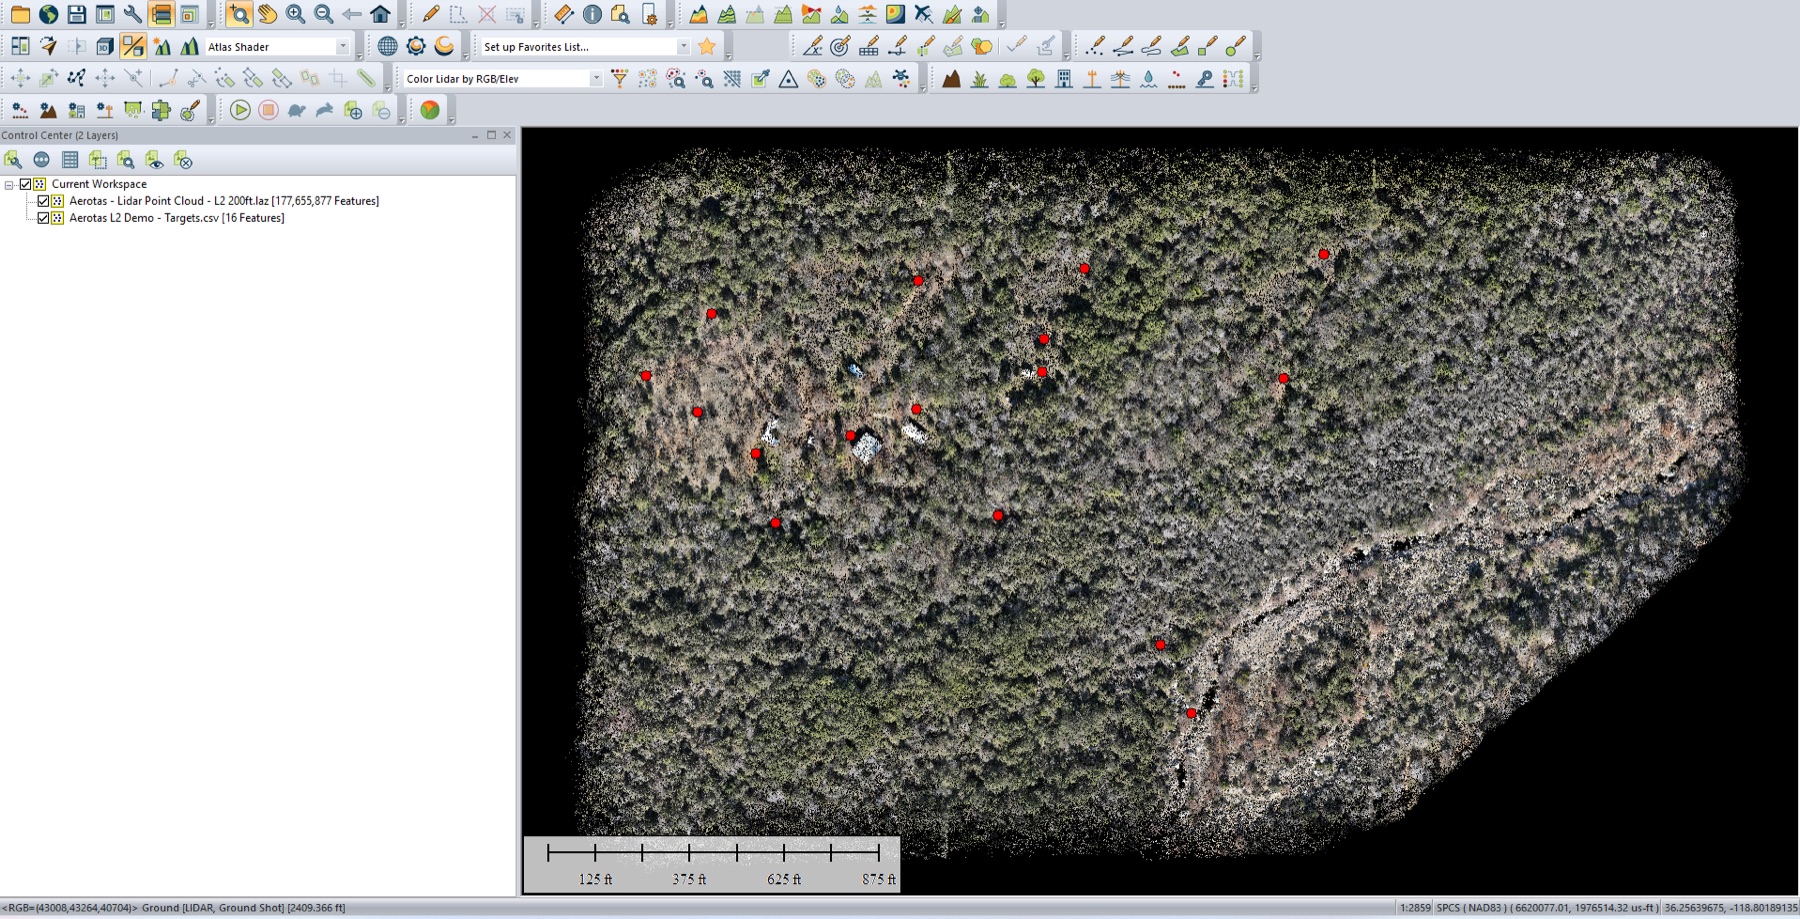
Given that the raw drone data was collected with a GPS base station set over an arbitrary point, it is necessary to georeference the lidar data before any accuracy measurements can be done. There are numerous ways to achieve this. This can be done by either post-processing the base station data itself, or aligning the point cloud to know marked targets. While either method is valid, we chose to use ground control points to ensure that photogrammetry data, ground data, and lidar data were all optimally aligned in the simplest workflow possible. From here, all work was performed in Global Mapper software.
Lidar Results
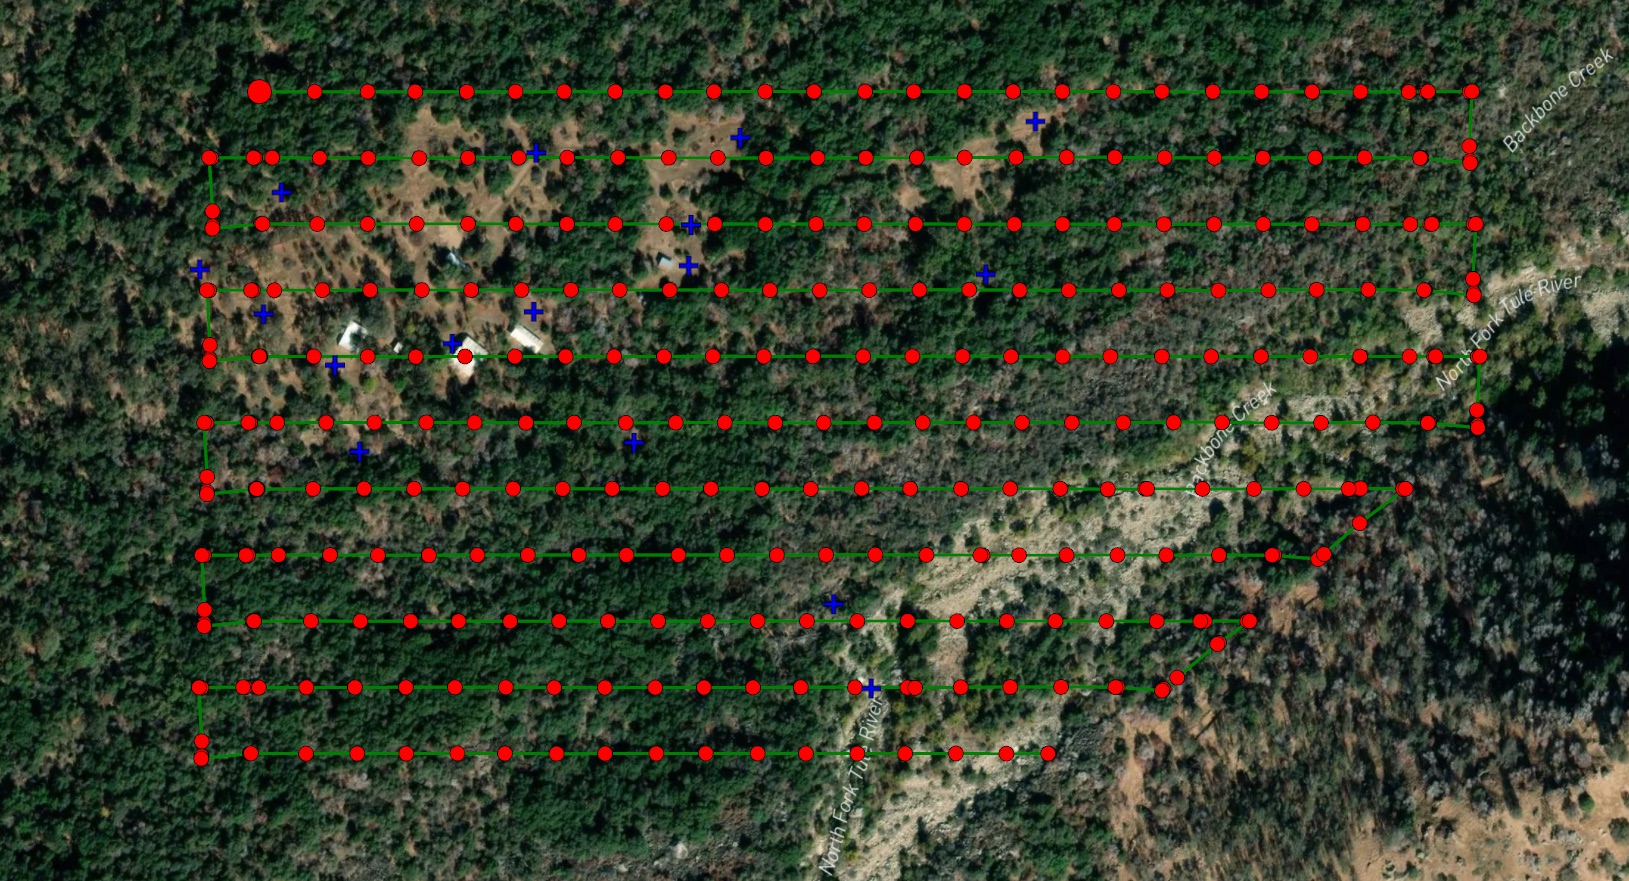
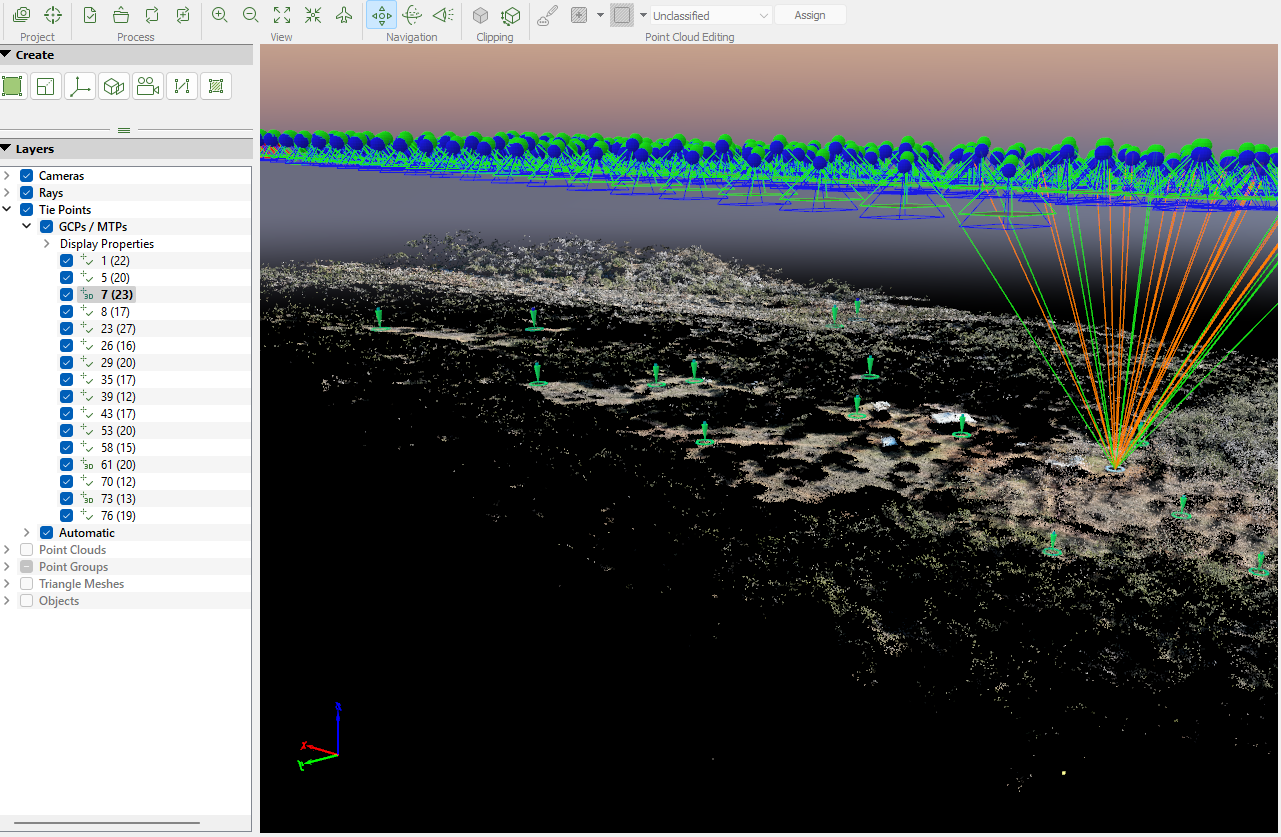
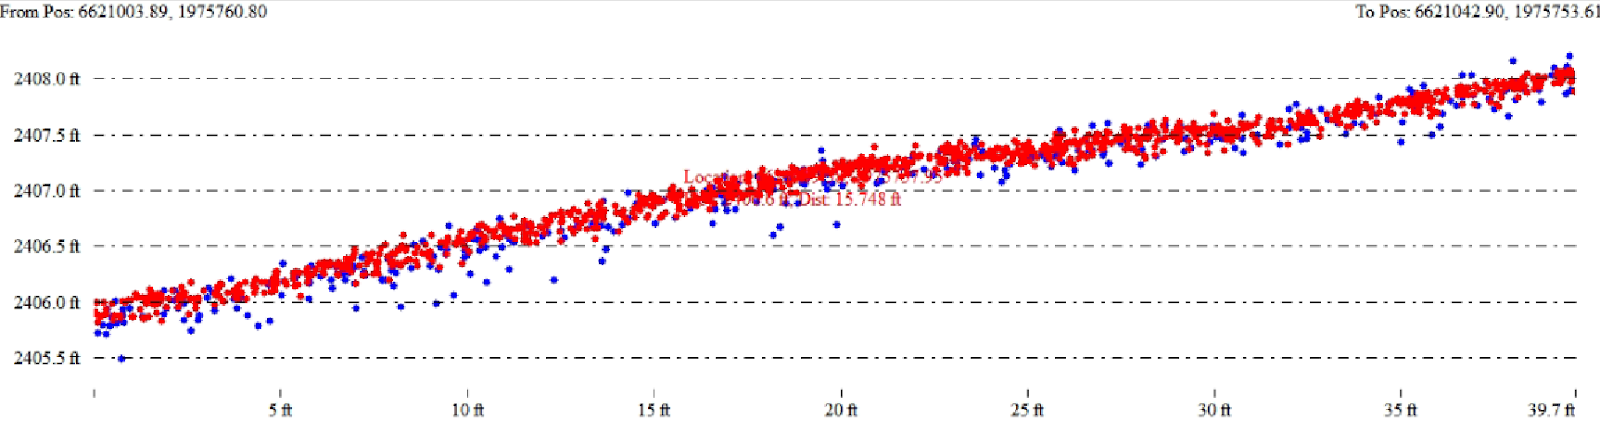
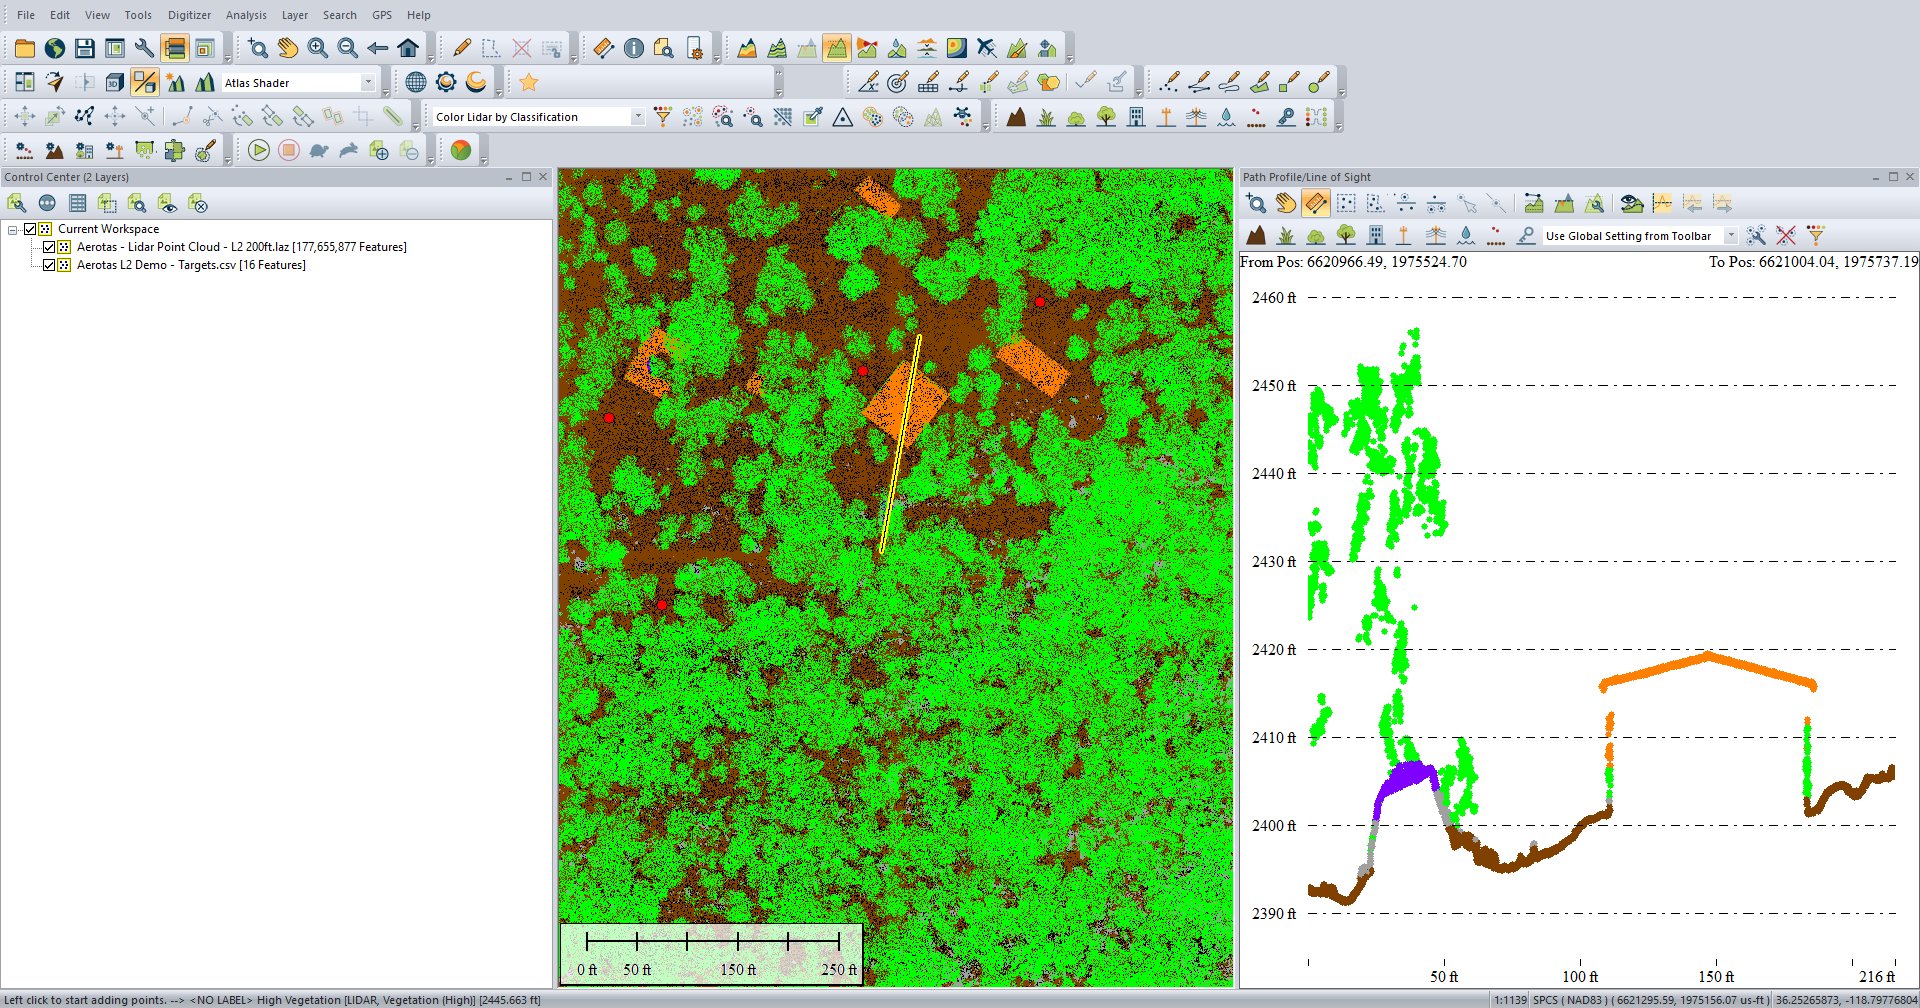
As expected, the lower flight altitude resulted in a much denser overall point cloud, with higher resolution of sharp features. As can be seen in the below screenshot, the red (200’ AGL) points are denser and tighter than the blue 400’ AGL points. And this is reflected in the accuracy as well.
Vertical accuracy was measured across 3 distinct categories for this test. Marked targets were against specifically set and visible marked targets. Unmarked points were against points measured on rocks, dirt, or light grassy vegetation. Vegetated points were measured in areas with at least 0.5’ of vegetation present, sometimes up to 30’ worth of tree cover or multiple layers of vegetated canopies. In all cases, accuracy was measured relative to an average of the points within the point cloud in a 1’ diameter surrounding the target point.
As would be expected, the 200’ AGL lidar flight was more accurate than the flight at 400’ AGL. Further, unmarked targets on dirt and grass showed lower overall accuracy on both flights, but with the 200’ AGL flight maintaining higher accurate than the 400’ flight.
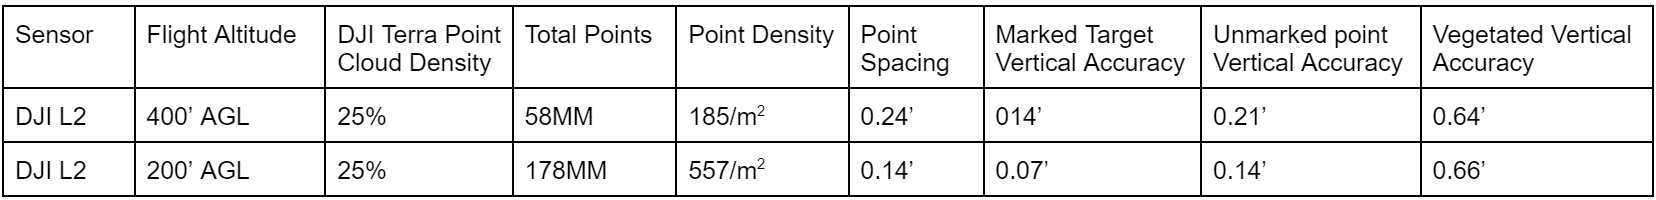
Vegetated accuracy is a bit different, as both flight altitudes showed roughly similar vegetated accuracy of 0.6’. This, however, is not necessarily a fully fair assessment of the L2 sensor, as many of the vegetated checkpoints were taken in deliberately challenging environments, such as extremely dense brush piles and very thick low-lying vegetation. If these checkpoints are removed, then both the 200’ and 400’ flights have a vegetated vertical accuracy of approximately 0.25’. While this is still lower than the non-vegetated areas, it is impressive given the extremely dense vegetation on the site.
It is notable that vegetated vertical accuracy is not materially affected by the flight altitude, as both the 200’ and 400’ flights produced comparable vertical accuracy. A subjective analysis of the two different flights reveals that while the 200’ flight did produce higher point density, the actual penetration of vegetation was not materially different between the two flights.
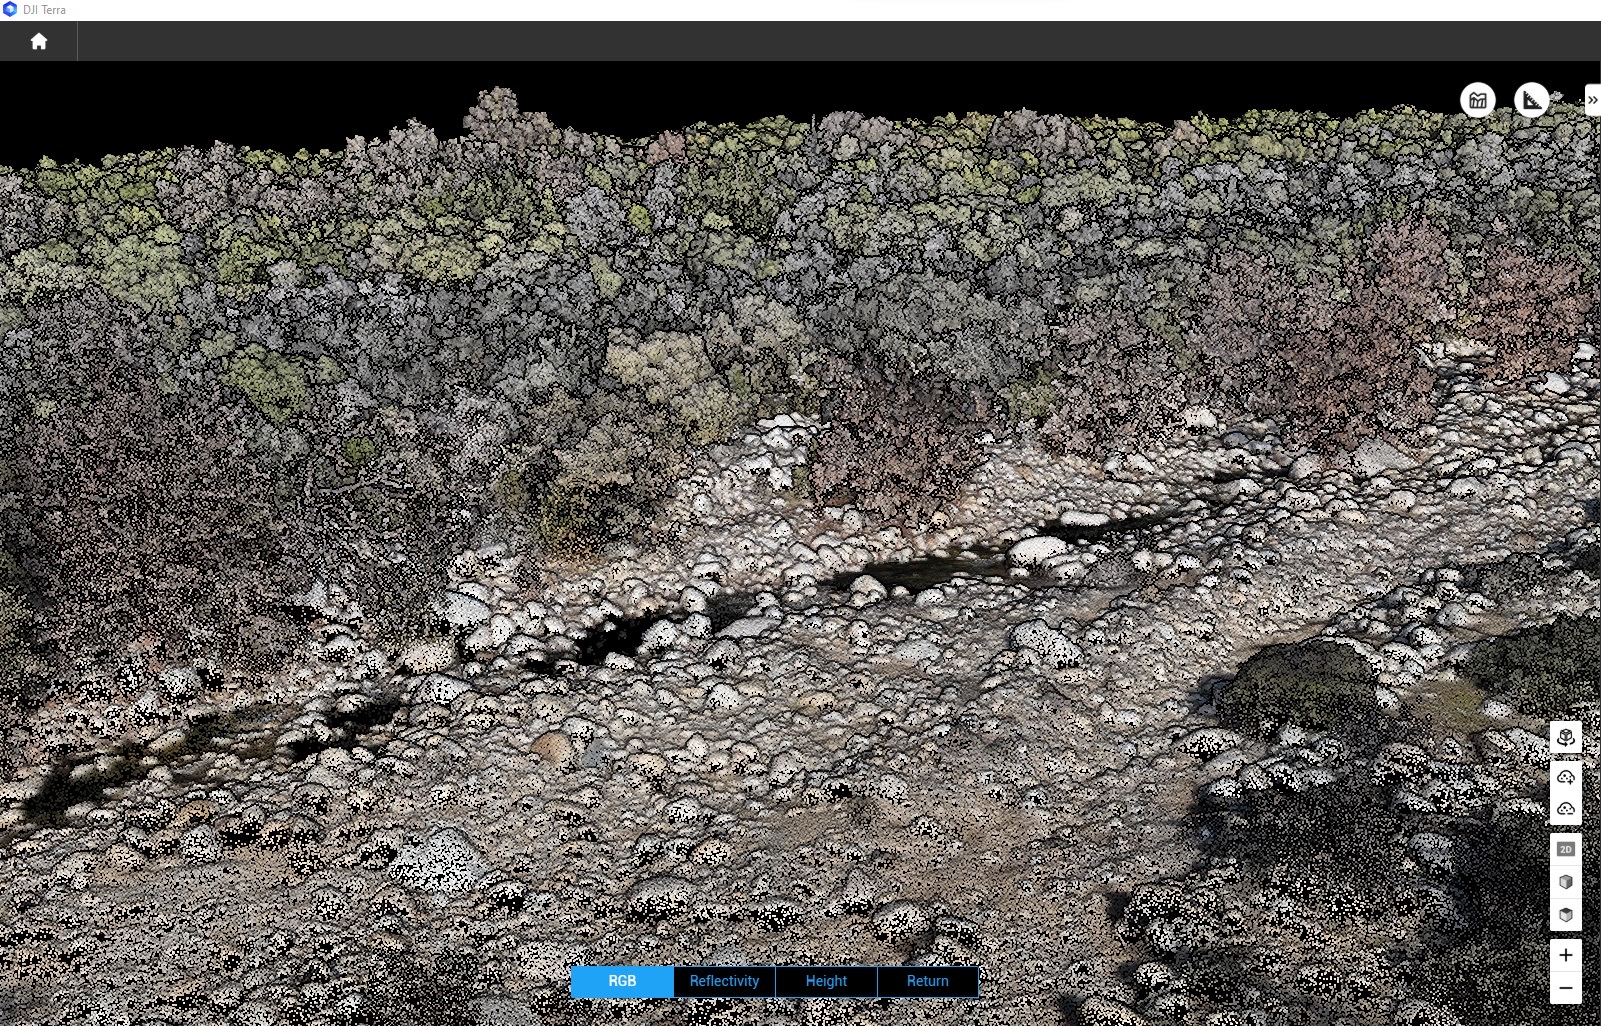
From a purely subjective analysis, we were incredibly impressed by the L2’s ability to penetrate vegetation on this site. We have seen thousands of lidar projects across dozens of different systems and nearly every form of vegetation on the planet, and only tropical jungle canopy is a more challenging biome for lidar penetration. And that the L2 was able to have near perfect canopy penetration even at 400’ for the bulk of the project site is fantastic.
But ultimately there are two factors that contribute to vegetated accuracy in lidar mapping. Vegetation penetration is the first factor, and is quite good on the L2. It is still subject to the same challenges that all lidar systems experience where extremely dense grasses, shrubs, or jungle will block out all light and cause gaps. However, the L2 subjectively appears to be among the best.
The second factor that contributes to vegetated accuracy in lidar mapping is point cloud classification.
Lidar Classification
Much of what has been discussed so far has been focused on the scientific aspects of aerial mapping. However classification of lidar point clouds is much more of an art than a science. There are hundreds of softwares in existence that can perform some form of lidar point cloud classification, utilizing thousands of different algorithms, with infinite permutations of settings and variables and classification schemes to determine exactly what is ground, high vegetation, low vegetation, objects, buildings, power lines, etc.
For this project, we used a proprietary workflow of mostly automated tools to attempt to classify the point cloud. However, this was made much more challenging by the extremely rough and uneven nature of the terrain, notably the large quantities of rocks and boulders of every size imaginable.
One of the primary goals in lidar classification is to separate “ground” from everything else. However, to do so, you first need to even define what ground actually is. Generally, rocks are considered to be a part of the ground. However, 15’ boulders that are on top of otherwise flat terrain could be considered either part of the ground, or an object that is on top of the ground. And a 15’ boulder that gently slopes up until becoming a sheer cliff on the other side might be considered differently. And ultimately writing an algorithm that makes all of these judgment calls thousands of times in a time and cost efficient manner is extremely difficult, even with the most advanced artificial intelligence and machine learning algorithms available.
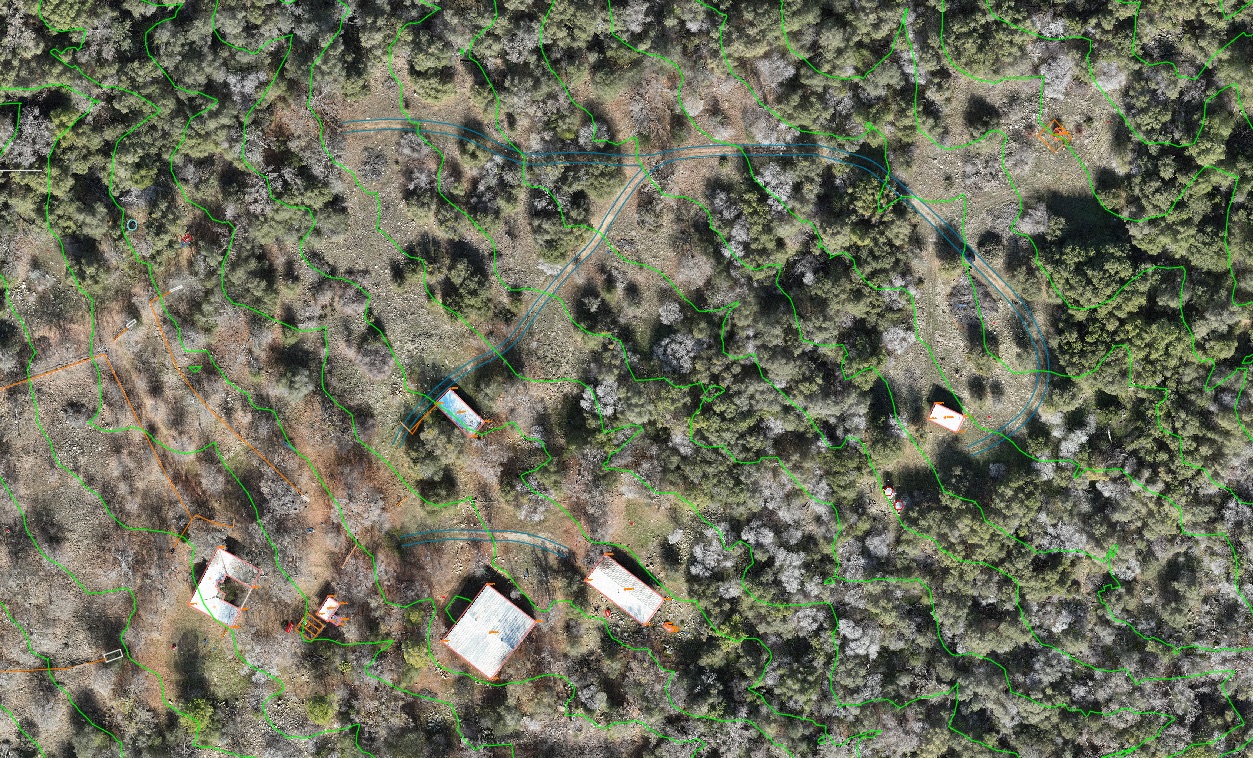
For this project, we devised a series of sequential algorithms to classify different types of vegetation and objects based on their vertical distance from other points, slope relative to other points, and some assumptions made about the likely slope of the terrain. However, this project was classified using only automated methodology, and not a full manual classification. As such, the point cloud data as shown here will have some points that are misclassified. Full classification is possible with a great deal of manual labor, but is often unnecessary to create a high quality final product deliverable.
Drafting
At Aerotas, drafting is what we call the process of converting all the high resolution files, like orthophotos and point clouds, into usable maps and CAD files. This often involves a handful of steps, ranging from the drafting of certain vector features like buildings or roads, to the blending of photogrammetric and lidar data into a single CAD file. Given the highly vegetated nature of this particular project, the drafting phase is not extremely time consuming. The majority of the time in drafting was spent cleaning lidar point cloud data and converting it into a more useful TIN surface. The orthophoto is converted into a CAD-friendly version using the ECW compression format, so that it can be more easily downloaded and shared. Finally, all of the data is converted into Civil3D .dwg format for final delivery.
Project Limitations and Future Research
This project and analysis was intended both to showcase the capabilities of the DJI L2 sensor, while providing a high quality dataset for research and educational purposes. However, there is a considerable amount of additional research and analysis that could be performed on this dataset. Specifically, additional iterations of photogrammetric processing, with different permutations of ground control points, PPK processing, or photogrammetry software or settings could potentially improve the quality of the photogrammetric results. Additional processing of Lidar or IMU data could also improve the accuracy and quality of the lidar point cloud. And more than anything else, different algorithms for classifying ground vs non-ground objects could have meaningful impacts to the look and feel of the final result given the large amount of rocky terrain.
We have done our best to perform a reasonable and professional level of processing and analysis on the project that we have provided here. However we encourage the community to download the raw data and perform your own research, processing, and analysis, and share the results with the broader surveying community.
Conclusion
Overall, the L2 is absolutely capable of providing quality survey data at both 200’ and 400’ altitudes, and is a high quality sensor. But as with other sensors, there is no magic set of flight altitudes or settings that is right for every project. Whether it is flight altitude, overlap, sensor used, processing methodology, or number and distribution of ground control points, the number of possible permutations in each individual surveying project is simply too large to simplify into a single set of results.
However, despite all the possible complexities, the DJI L2 can produce high quality results that are relatively reliable and straightforward to process, and we have no trouble recommending the L2 to any surveyors interested in purchasing a Lidar sensor.
Data Available for Download
As part of publishing this data, we are making all of the data from these flights available to the public. So if you are looking for high quality lidar data you can use to research, develop, or improve your own data processing abilities, then this is the right place, and it can be downloaded here.
Please note, that the downloads have been broken into a handful of different links due to the large quantity of data.
Download the DJI L2 Test Data
Enter your email address and Aerotas will send the full download email with raw flight data, ground data, intermediate outputs, and the final Civil 3D deliverable package.